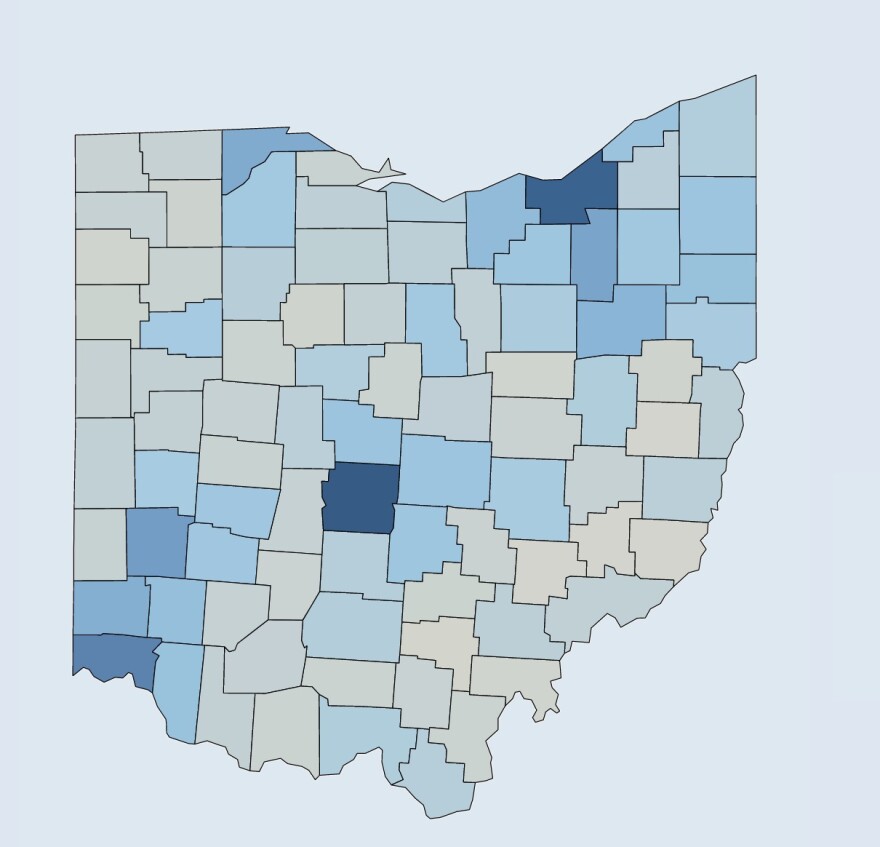
Mask guidelines throughout Ohio and the country have been relaxed in recent weeks, with changes in how the seriousness of community spread of COVID is determined.

If you looked at COVID maps on Ohio and the CDC’s websites on February 24, you would see a lot of counties were at the highest level of community spread. But now, those maps look vastly different. Ohio Dept of Health Director Dr. Bruce Vanderhoff says it’s not just because of the declining level of cases.
“The CDC is focusing on the severity of illness in a community. It’s reflected by the percentage of hospital capacity beds devoted to caring for COVID-19 patients as well as the number of new COVID patients admitted to hospitals," Vanderhoff says.

While it might appear the goalposts were moved in COVID metrics, Vanderhoff says the CDC and Ohio have been shifting from case counts to hospitalizations because they give a more accurate assessment of COVID spread in communities.


